_SECTION_BEGIN(” ST PRICE”);
SetChartBkColor( ParamColor(“Chart Color”, colorWhite));
SetChartOptions(0, chartShowArrows | chartShowDates);
SetChartOptions(0,chartShowArrows|chartShowDates);
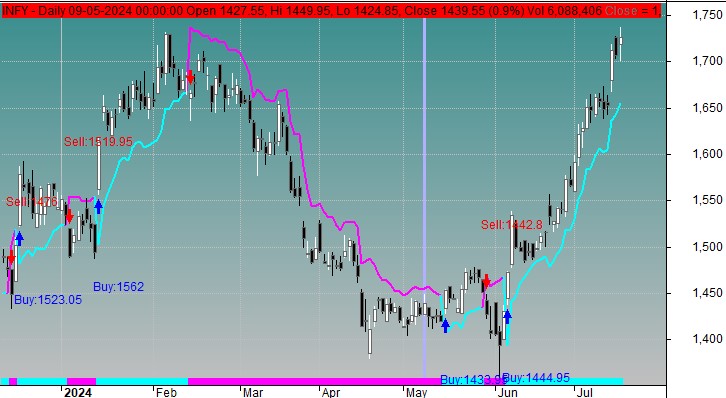
_N(Title = StrFormat(“{{NAME}} – {{INTERVAL}} {{DATE}} Open %g, Hi %g, Lo %g, Close %g (%.1f%%) Vol ” +WriteVal( V, 1.0 ) +” {{VALUES}}”, O, H, L, C, SelectedValue( ROC( C, 1 )) ));
SetChartBkGradientFill(ParamColor(“Top”, colorTeal), ParamColor(“Bottom”, colorLightGrey), ParamColor(“Title”, colorRed));
SetChartBkColor(colorTeal);
SetChartOptions(0,chartShowArrows | chartShowDates);
_SECTION_BEGIN(“Magnified Market Price”);
FS=Param(“Font Size”,30,30,100,1); GfxSelectFont(“Arial”, FS, 900, italic = False, underline = False, True );
GfxSetBkMode( colorWhite ); GfxSetTextColor( ParamColor(“Color”,colorYellow) );
Hor=Param(“Horizontal Position”,800,800,800,800);
Hor=Param(“Horizontal Position”,20,20,500,20);
Ver=Param(“Vertical Position”,50,50,250,50);
GfxTextOut(“”+C,Hor , Ver );
YC=TimeFrameGetPrice(“C”,inDaily,-1);
DD=Prec(C-YC,2); xx=Prec((DD/YC)*100,2);
GfxSelectFont(“Arial”, 12, 700, italic = False, underline = False, True );
GfxSetBkMode( colorWhite );
GfxSetTextColor(ParamColor(“Color”,colorYellow) );
GfxTextOut(“”+DD+” (“+xx+”%)”, Hor+5, Ver+45 );
_SECTION_END();
_SECTION_BEGIN(“HAPPY TREND”);
SetBarsRequired(1000000, 1000000);
SetChartOptions(2,chartShowArrows|chartShowDates);
SetTradeDelays(0,0,0,0);
period = Param(“Period”, 4, 1, 240, 1);
mult = Param(“Multiplier”, 2, 1, 240, 0.1);
showPrice = ParamToggle(“Show Price”,”No|yes”,1);
showArrows = ParamToggle(“Show Arrows”,”No|yes”,1);
showRibbon = ParamToggle(“Show Ribbon”,”No|yes”,1);
f=ATR(period);
VS[0] = Close[0];
trend[0] = 0;
HighC[0]=0;
Lowc[0]=0;
for( i = period+1; i < BarCount; i++ ) { vs[i] = vs[i-1]; trend[i] = trend[i-1]; highC[i] = HighC[i-1]; lowc[i] = lowc[i-1]; if ((trend[i]>=0) && ( C[i] VS[i]))
{
trend[i]=1;
HighC[i] = C[i];
lowc[i] = C[i];
}
if (trend[i]==-1)
{
if (C[i]<lowc[i]) lowc[i] = C[i];
VS[i]= lowc[i]+ (multf[i]); } if (trend[i]==1) { if (C[i]>HighC[i]) HighC[i] = C[i]; VS[i]= HighC[i]-(multf[i]);
}
}
Buy1=Cross(Trend,0);
Sell1=Cross(0, Trend);
if (ShowPrice) Plot(Close,”Close”,colorGrey40,styleCandle);
Plot(VS, “Vol Stop”,IIf(trend==1,10,11 ),styleThick);
mkol = IIf( Trend==1, 10, 11);
if (ShowRibbon) Plot(5, “ribbon”, mkol, styleOwnScale|styleArea|styleNoLabel|styleNoTitle, 0, -5);
_SECTION_END();
SetChartBkColor( ParamColor( “Outer panel”,colorWhite) );
_SECTION_BEGIN(“PRICE”);
SetChartOptions(0,chartShowArrows|chartShowDates);
Plot( C, “CLOSE”, ParamColor(“COLOR”, colorDefault ), styleNoTitle | ParamStyle(“STYLE”) | GetPriceStyle() );
_SECTION_END();
A = RSI(14) > EMA(RSI(14), 14);
B = RSI(14) < EMA(RSI(14), 14);
Buy = Buy1 AND A;
Sell = Sell1 AND B;
Buy = ExRem(Buy, Sell);
Sell = ExRem(Sell, Buy);
shape = Buy * shapeUpArrow + Sell * shapeDownArrow;
PlotShapes(shape, IIf(Buy,colorBlue,colorRed), 0, IIf(Buy,Low,High));
dist = ATR(20);
for (i=0; i<BarCount; i++) {
if ( Buy[i] )
PlotText(“Buy:” + O[ i ], i, L[ i ]-3dist[i], colorBlue); if ( Sell[i] ) PlotText(“Sell:” + O[ i ], i, H[ i ]+3dist[i], colorRed);;
}
_SECTION_END();